Optimisation Without Overfitting: A Step-by-Step Process for Tuning Forex EAs Safely
EA Trading • 12 min read
Every EA trader eventually falls in love with a backtest. The equity curve climbs in a smooth diagonal line, the drawdown looks tame, and the profit factor sits comfortably above 2.0. Then the EA goes live — and within a few weeks, the "perfect" strategy starts losing money in ways the backtest never predicted.
This is the classic signature of overfitting: an Expert Advisor that has been optimised to match the noise of historical price data rather than the underlying market behaviour that actually repeats. The good news is that overfitting is largely preventable. It isn't caused by bad luck — it's caused by a flawed optimisation process. This guide walks through a disciplined, repeatable method for tuning an EA's parameters so that the results you see in MetaTrader's Strategy Tester have a genuine chance of holding up in live trading.
What Overfitting Actually Looks Like
Overfitting happens when an optimisation algorithm is given enough parameters and enough freedom that it can "discover" a combination of settings that happens to fit one specific slice of historical data extremely well — even though that fit has nothing to do with a real, repeatable market edge. The strategy hasn't learned a pattern; it has memorised the past.
A few warning signs are worth knowing:
- A jagged optimisation surface. If changing one input by a tiny amount (say, moving a moving average period from 10 to 11) causes results to swing wildly, the "best" result is likely a statistical accident rather than a stable edge.
- Too many free parameters. The more inputs an EA exposes to the optimiser, the more combinations exist — and the higher the odds that one of them will look great purely by chance.
- A single, narrow test window. Optimising over one 2–3 year period and never checking anything else is one of the most common mistakes EA traders make.
- Backtest results that are dramatically better than any live or demo track record. If nothing else in this article sticks, remember this one: the backtest should be the floor of your expectations, not the ceiling.
The Core Principle: Never Judge a Strategy on the Data You Tuned It With
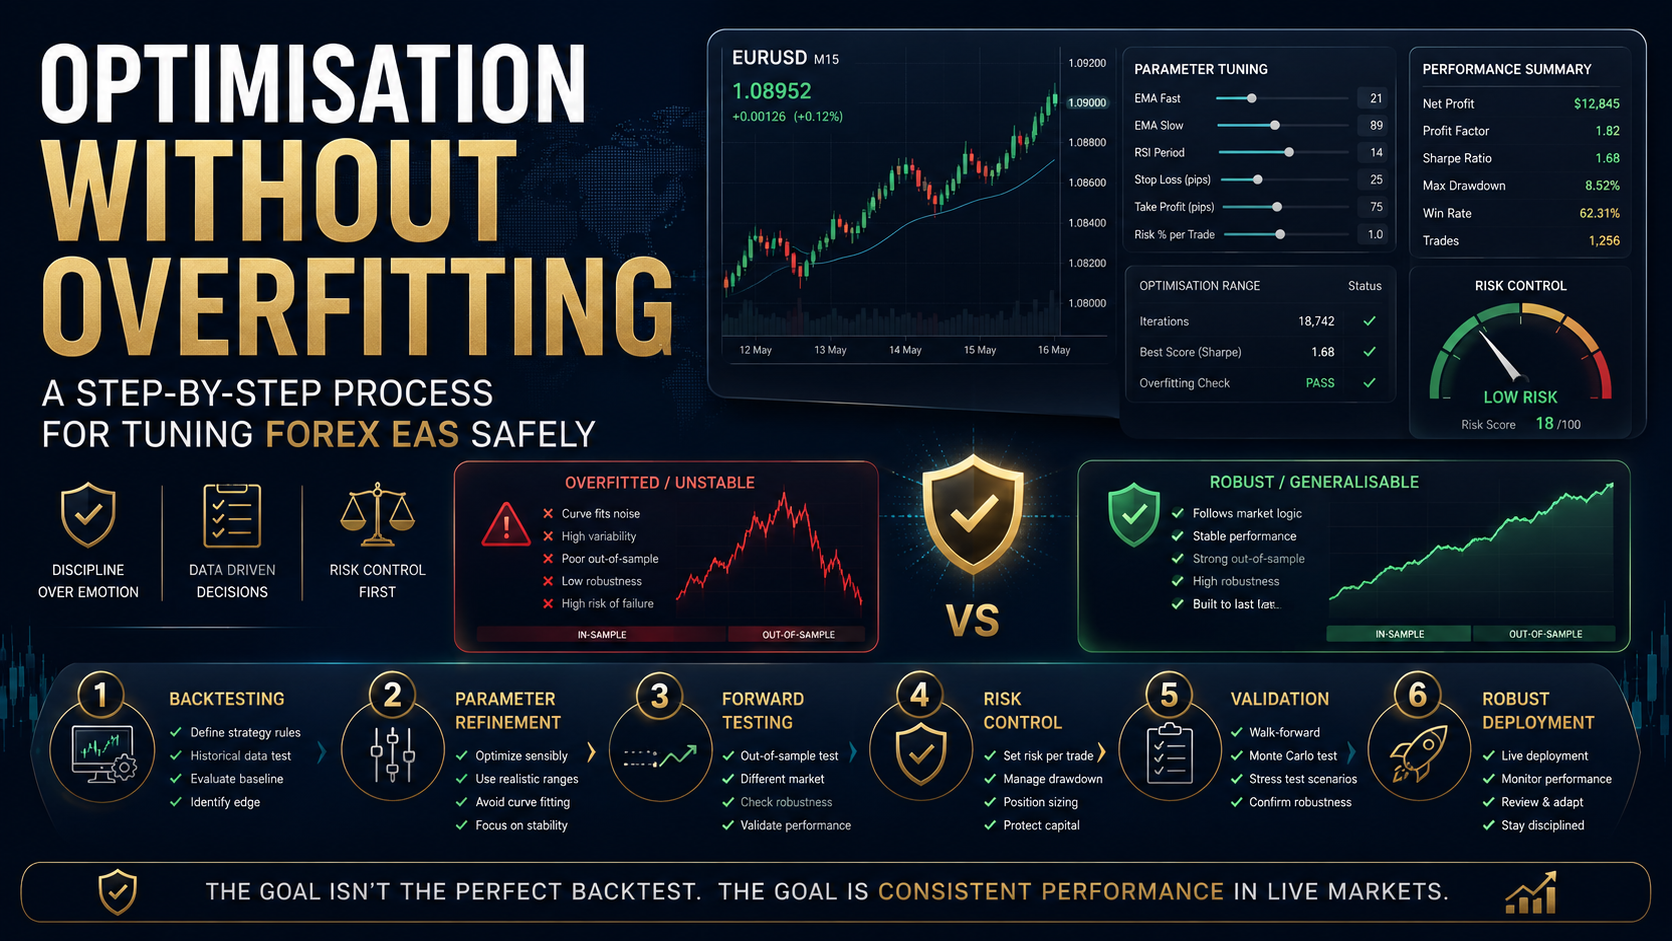
Every technique in this guide is really one idea applied in different ways: the data used to choose your parameters must be kept separate from the data used to judge your parameters. As soon as those two data sets overlap, your test results become biased in the optimiser's favour, because the optimiser was explicitly rewarded for fitting that exact history.
Step 1 — Split Your Historical Data Before You Touch the Optimiser
Before running a single optimisation pass, divide your available price history into two blocks:
- In-sample (IS) data — typically 60–75% of your history, used for optimisation.
- Out-of-sample (OOS) data — the remaining 25–40%, set aside and left completely untouched until optimisation is finished.
Try to include multiple market regimes in your data set — trending periods, ranging periods, and at least one high-volatility event (a rate decision, a flash move, or a period like March 2020). A grid or martingale-style EA in particular needs to prove it can survive a genuine trending shock, not just calm, mean-reverting conditions.
Step 2 — Limit the Optimiser's Freedom
Before optimising, decide which inputs genuinely need tuning and which should stay fixed based on the EA's design logic. As a rule of thumb, the fewer parameters you hand to the optimiser, the less room it has to curve-fit noise. If your EA has 15 adjustable inputs, consider locking down the ones that are structural (basket spacing logic, lot progression method) and only optimise the two or three that are genuinely market-dependent, such as entry timing or a moving average period.
When you do get results back, don't just take the single best-performing parameter set. Look at the optimisation report as a landscape. A stable, profitable "plateau" — a wide range of neighbouring parameter values that all produce decent, similar results — is far more trustworthy than one isolated spike sitting alone at the top of the results table.
Step 3 — Run Walk-Forward Optimisation
Walk-forward optimisation (WFO) is widely regarded as the gold standard for validating a trading system, a method first formalised by Robert Pardo and now standard practice across quantitative trading. Instead of one big in-sample/out-of-sample split, WFO repeats the process multiple times on rolling windows, forcing the strategy to prove itself again and again on data it has never seen — which is a much closer simulation of how the EA will actually be used in live trading.
In practice, a walk-forward run looks like this:
- Optimise on window 1 (e.g. Jan–Dec 2022).
- Test the resulting parameters, unchanged, on the next segment (e.g. Jan–Mar 2023).
- Slide the whole window forward and re-optimise (e.g. Apr 2022–Mar 2023).
- Test again on the next unseen segment (e.g. Apr–Jun 2023).
- Repeat this process across your entire history.
You can run this in "anchored" mode, where the in-sample start date stays fixed and the window simply grows, or "rolling" mode, where both the start and end date slide forward together, keeping the window length constant. Rolling mode is generally more realistic for forex, since it weights recent market behaviour more heavily and doesn't let an EA lean too heavily on outdated conditions from years ago.
A useful shortcut for judging the results is the walk-forward efficiency ratio — out-of-sample performance divided by in-sample performance. A ratio above roughly 0.5 is generally considered a reasonably healthy sign of robustness, while a ratio below about 0.3 is a strong indication the strategy is overfit to its training data.
One practical note for MT4/MT5 users: MetaTrader 5's Strategy Tester has a built-in forward-testing option that automates part of this process for you, whereas MT4 has no native walk-forward feature — you'll need to manually define and re-run each in-sample/out-of-sample segment yourself. Either way, the underlying discipline is identical.
Step 4 — Validate Out-of-Sample Results Honestly
Once your walk-forward run is complete, look at the combined out-of-sample results as if they were the EA's only track record — because in an important sense, they are. Ask yourself:
- Is the out-of-sample profit factor still comfortably above 1.0 across most windows, not just a lucky one or two?
- Is maximum drawdown in the out-of-sample segments in the same ballpark as in-sample, rather than dramatically worse?
- Does the equity curve stay reasonably smooth, or does it show sharp discontinuities between walk-forward segments?
If the out-of-sample numbers look meaningfully worse than the in-sample numbers, that's not a reason to re-optimise on the out-of-sample data too — doing so simply destroys the one clean test you had left. Instead, go back to Step 2 and simplify the strategy.
Step 5 — Stress-Test With Monte Carlo Simulation
Once you have parameters you trust, run a Monte Carlo simulation: randomly reshuffling the order of historical trades, and optionally adding random variation to spread and slippage, across hundreds or thousands of simulated runs. This won't tell you whether your strategy is profitable — the walk-forward test already answered that — but it will show you the realistic range of drawdowns you could face purely from an unlucky sequencing of the same trades. For a martingale or grid-based EA, this step is particularly important, since basket-based systems are sensitive to the order in which losing streaks occur.
Step 6 — Confirm Robustness Across Symbols and Timeframes
A genuinely robust edge tends to show at least some consistency across related pairs and neighbouring timeframes, even if performance isn't identical. If your EA is tuned for EURUSD M15 and performs brilliantly there but falls apart completely on GBPUSD M15 or on EURUSD H1, that's a signal the "edge" may be a historical accident specific to one dataset rather than a real, repeatable behaviour. You're not looking for identical results — you're looking for the same overall character: positive expectancy, similar drawdown profile, and no complete personality change.
Step 7 — Forward Test on a Demo Account Before Going Live
Backtests, no matter how carefully constructed, are still simulations. The final validation step is real-time forward testing on a demo account, ideally for 30 days or more, using live spreads and live execution conditions. This is where slippage, requotes, and broker-specific quirks show up — factors that even good tick-data backtests can't fully replicate. Only after a strategy has proven itself in walk-forward testing, Monte Carlo stress testing, and live demo forward testing should real capital be put behind it.
A Worked Example
Imagine an EURUSD grid EA with an SMA-based mean-reversion entry. A trader optimises the SMA period and basket take-profit distance over three years of data and finds that SMA(9) with a 47-point basket TP produces a spectacular profit factor of 3.1. But when the optimisation surface is examined, SMA(8) and SMA(10) both produce profit factors under 1.2 — a spike, not a plateau. Walk-forward testing across six rolling windows shows the out-of-sample efficiency ratio sitting at just 0.18. That's a clear overfitting red flag, and the honest move is to widen the parameter net, favour the more stable SMA(10)/50-point combination that performed consistently across every window, and accept a lower — but far more trustworthy — profit factor going forward.
Further Reading
- Walk Forward Optimization — Wikipedia overview of Pardo's original methodology
- QuantInsti: An Introduction to Walk-Forward Optimisation
- MQL5 community forum: Optimisation robustness and avoiding overfitting
Want a Grid EA That Was Already Built With This Process in Mind?
The Nexus EURUSD/GBPUSD EA was designed and validated using exactly the disciplined process outlined above — walk-forward tested, out-of-sample checked, and forward tested on live-verified accounts before ever being offered to clients. If you'd rather trade a system that's already been through this rigour than build and test your own from scratch, take a look.
Join Nexus Forex Trading Now →This article is for educational purposes only and does not constitute financial advice. Forex trading, and grid/martingale-style strategies in particular, carry substantial risk of loss. Always test on a demo account before trading live capital.