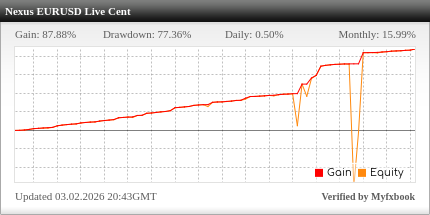
Real-money performance tracked and verified independently on Myfxbook. Review the equity curve, full trade history, monthly returns and drawdown — all publicly available, no login required.
5%+Monthly Target
~5%Max Drawdown
21+Years Backtested
LiveMyfxbook Verified
Real Money AccountLive funds, not a demo or simulation
Third-Party VerifiedIndependently tracked on Myfxbook
Full Trade HistoryEvery entry, exit and result visible
Updated in Real TimeLive dashboard — always current
Verified PerformanceReal-Money Tracking You Can Verify Independently
This page shows the live performance of our Nexus EURUSD EA running on a real-money trading account. All data is tracked publicly on Myfxbook — an independent, third-party platform used across the forex industry for verified account tracking. You can access the full live dashboard at any time here:
myfxbook.com/members/NexusFXtrading/nexus-eurusd-live-cent
Use these charts to review how performance moves across individual trading days. Reviewing both the percentage and dollar charts together gives the clearest picture of consistency and risk exposure over time.
Nexus Daily % Trading Gains
Daily percentage change over time — useful for identifying periods of higher volatility versus smoother, more stable market phases. Use this to assess consistency across different market conditions.
Nexus Daily $ Profit Gains
Daily dollar profit movements on the live account. Always review alongside the drawdown and equity curve for a complete picture — profit figures alone do not reflect the full risk profile.
Account AnalysisDetailed Performance Breakdown
A closer view of performance characteristics — helping you understand trade quality, win rate, and risk-adjusted returns across the live account.
Win Rate & Trade Distribution
Profit Factor & Return Analysis
Live PositionsCurrently Open Trades
Live view of any trades currently open on the Nexus EA account. If no trades are shown, the EA is monitoring the market and waiting for its entry conditions to be met.
Understanding the DataWhat to Look For in the Dashboard
New to reading live trading data? Here is what each key metric tells you about the EA's real-world performance and risk management.
Equity Curve
Shows how account equity grows over time. A smooth upward curve indicates consistent performance. Dips reflect normal drawdown periods — assess their depth and recovery speed.
Maximum Drawdown
The largest peak-to-trough decline in the account. One of the most important risk indicators — the Nexus EA targets a maximum drawdown of approximately 5%.
Monthly Returns
The percentage profit or loss for each calendar month. Review across multiple months to assess consistency rather than focusing on any single strong or weak month in isolation.
Win Rate
The percentage of trades that closed in profit. A high win rate alone is not sufficient — always review it alongside average win size versus average loss size for a fair picture.
Profit Factor
Total gross profit divided by total gross loss. A profit factor above 1.0 means the account is profitable overall. Higher values indicate stronger risk-adjusted performance.
Full Trade History
Every individual trade — entry, exit, duration, result and lot size — is publicly visible. This gives you complete transparency into how and when the EA operates in live conditions.
Month-by-Month ResultsMonthly Performance Reports
Each report gives a structured breakdown of the EA's performance for that specific month — results, key metrics, trading activity and notable conditions. Every report links back to the live Myfxbook dashboard for independent verification.
Every element of Nexus Forex Trading is built around one principle: you should be able to verify everything we claim. We do not ask you to trust marketing copy or rely on screenshots. We show live, independently tracked data so you can make an informed decision before you spend a penny.
Real-money Myfxbook-verified account — publicly accessible, always live
Full transparency — every trade, every drawdown, every result is visible
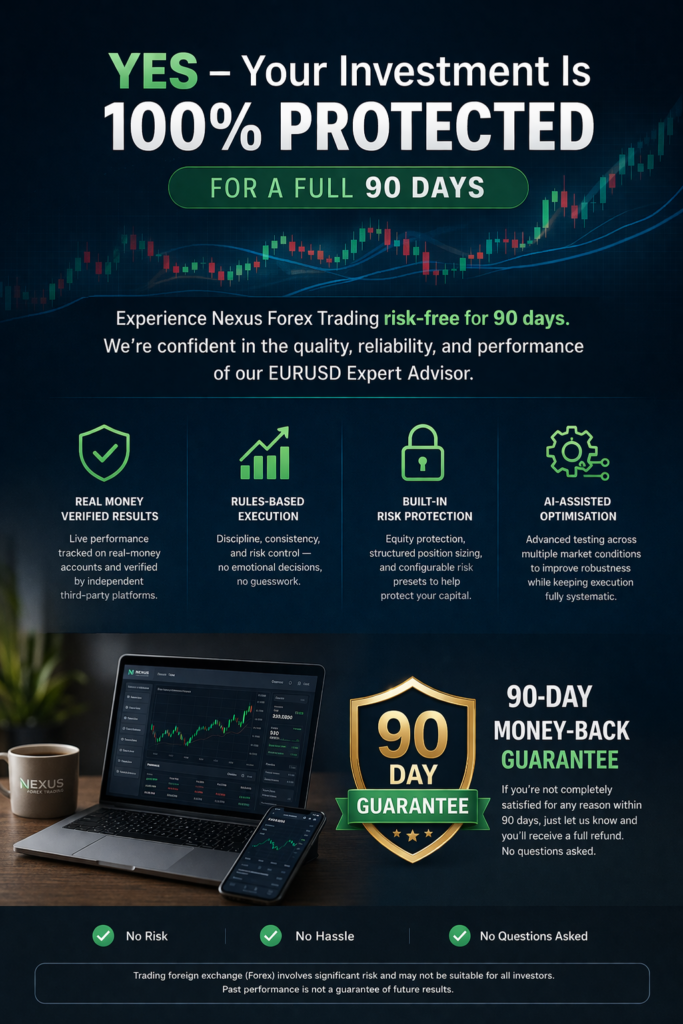
Risk-first engineering — ~5% equity protection built into every preset
Responsive support — email queries answered within 24 hours
Up to 15 demo accounts — validate before you commit real capital
Up to 10 approved live accounts — included with every purchase
You Have Reviewed the Live Data
The Results Are Real. Now It's Your Turn.
You have just reviewed independently verified, real-money performance — not backtests, not demo screenshots. The same system is available to you today from $99.95.
Real money. Not a demo
Third-party verified. Myfxbook
Risk-first. ~5% equity protection
Same-day onboarding. Full support
Not ready to go live yet?
Every purchase includes up to 15 demo accounts and up to 10 approved live accounts. Validate the EA in a demo environment for as long as you need before committing real capital.
Concerned about setup?
You receive a complete onboarding package with step-by-step instructions, screenshots and a video walkthrough. Most clients are fully configured and running on the same day they receive their files.
Worried about risk?
The EA is engineered risk-first — built-in ~5% equity protection, disciplined position sizing presets and max-trade limits. Choose Conservative, Moderate or Aggressive and the EA enforces your rules automatically.
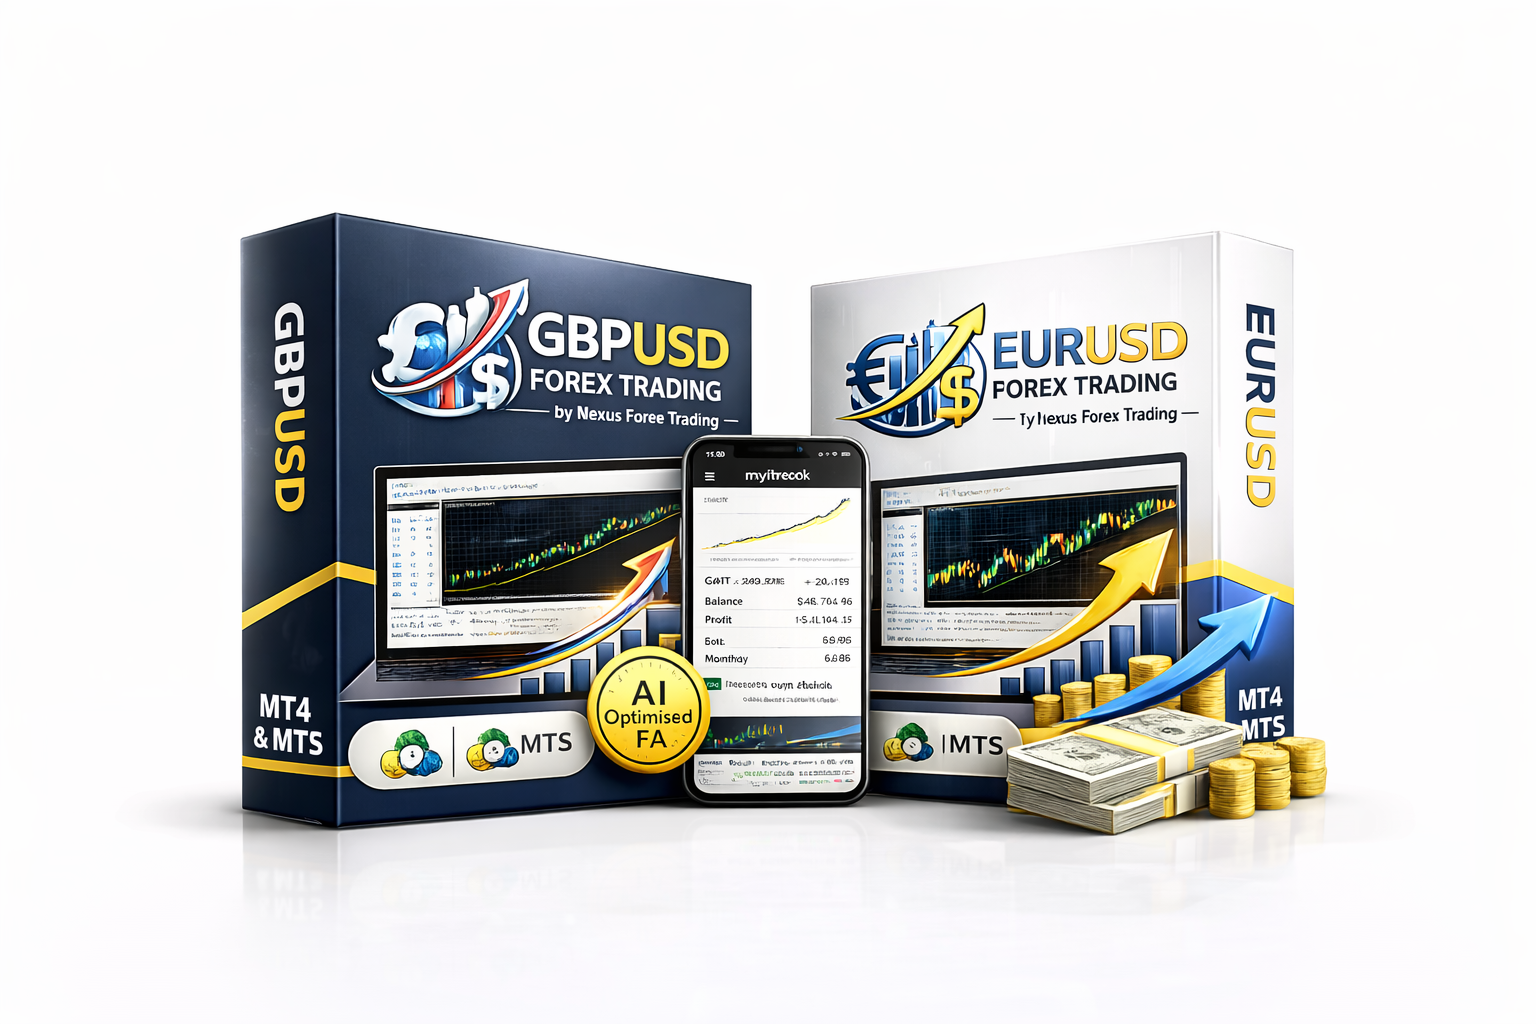
Choose Your EA — Same Verified System, Three Options
All packages include free activation with a preferred partner broker signup. View partner brokers →
EURUSD
EURUSD Forex EAThe verified EURUSD EA — the same strategy behind our live Myfxbook-tracked account. M15 timeframe, RSI-driven, equity protected.
GBPUSD Forex EADedicated GBPUSD engine built for one of the most actively traded major pairs. M5 timeframe, RSI-driven with pair-specific logic optimised for GBPUSD conditions.