January closed out with exactly the kind of performance we love to report on: steady execution, strong consistency, and real-world live conditions (spreads, swaps, and fills) — all tracked on a live USD cent account you can verify independently.
And because this is a cent account, every value has been converted correctly by dividing by 100 (example: 1,424 cents = $14.24). All numbers below are already shown in real USD terms.
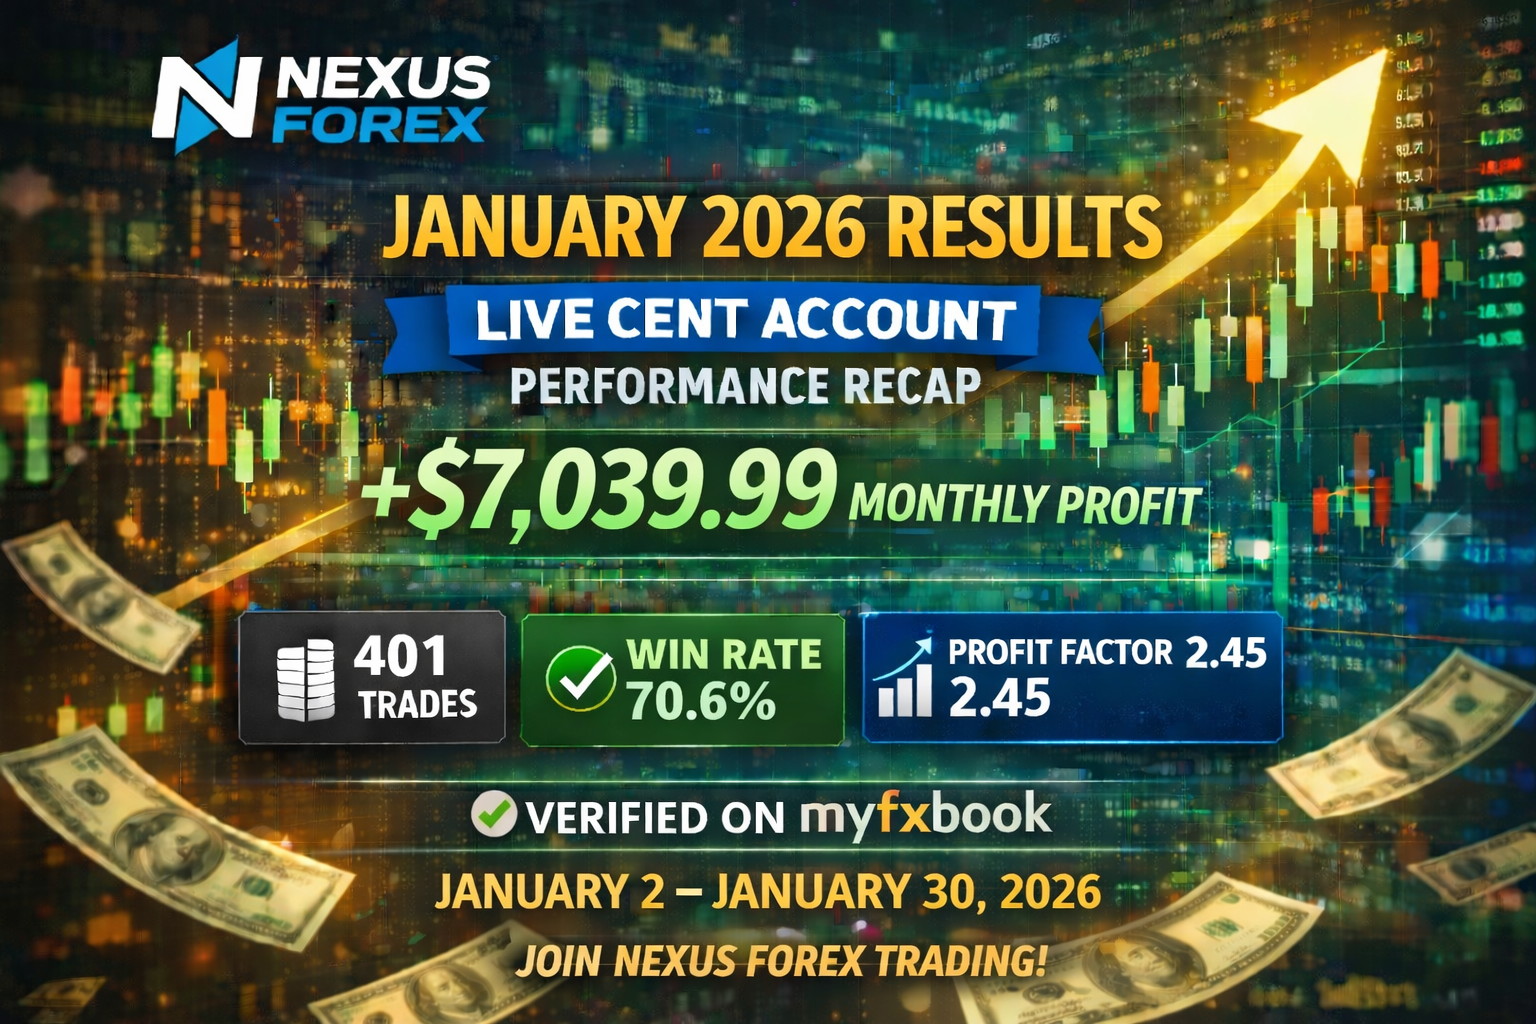
The headline numbers (January 2–30, 2026)
Here’s what Nexus delivered across the month:
- Gross trading P/L (before swaps): $7,054.63
- Total swaps: -$14.64
- ✅ Net P/L (after swaps): $7,039.99
- Total closed trades: 401
- Win rate: 70.6% (283 wins / 118 losses)
- Profit Factor: 2.45 (Gross Profit $11,912.12 vs. Gross Loss $4,857.49)
- Active close days: 18
- ✅ Green days: 17 / 18
- ❌ Red days: 1 / 18
- Best day: January 21, 2026 → +$1,224.79 net
- Worst day: January 27, 2026 → -$333.63 net
That’s a month where the system didn’t just “win big once” — it showed up repeatedly, week after week.
What stands out most: consistency + controlled downside
A lot of traders focus only on the profit number, but the real story in this report is the shape of the month:
✅ 17 green days out of 18
That’s not hype — that’s repeatable execution. It also included a 16-day green streak across active close days, which is the kind of consistency traders look for when deciding if a system is “real” or just had a lucky run.
✅ Profit Factor of 2.45 (edge + efficiency)
A 2.45 profit factor means the system brought in about $2.45 in gross profit for every $1.00 of gross loss. That’s a healthy signal of strategy edge without needing unrealistic win rates or oversized risk.
✅ Swaps stayed small relative to total performance
Swaps were -$14.64 across the full month — a minor drag compared with the overall month’s net outcome. That matters because it shows the strategy isn’t dependent on “swap tricks” or fragile assumptions.
Trade behavior snapshot (helps explain why the results look this way)
A few stats that show how this month was built:
- Buy vs Sell balance: 204 buys vs 197 sells
→ Nice symmetry — not one-sided guessing. - Average holding time: ~8h 45m
- Median holding time: ~2h 33m
- Trades held over 24 hours: 43 trades (~10.7%)
This is important because it signals adaptive trade management — many positions close the same day, while a smaller portion ride longer when conditions require it.
Weekly momentum (how January was “stacked”)
Rather than one lucky burst, the month was built through multiple strong weeks:
- Jan 2: +$65.35 net (small but positive start)
- Jan 5–9: +$2,790.66 net
- Jan 12–16: +$1,433.79 net
- Jan 19–23: +$3,071.03 net (strongest week)
- Jan 27–30: -$320.83 net (the only down patch)
Even with the late-month dip, January still finished comfortably positive, which is exactly what you want to see in a strategy designed around risk-first execution.
Verify the results independently (no trust required)
If you want to review the performance directly (including the account type and tracking dashboard), you can verify the Nexus EURUSD live trading account via Myfxbook.
This matters because it’s not demo, not backtest, and not a screenshot — it’s a third-party performance tracker.
Want to replicate this approach?
If you’re reading these results thinking: “I want a system that trades with structure and removes emotion from execution,” that’s exactly what the Nexus Forex Trading EA Bots are built for.
✅ Rules-based automation
✅ Live-account transparency
✅ Designed for consistency and risk control
✅ Built to run on MT4 with clear setup support
If you want to start working toward results like the month above, you can join Nexus Forex Trading and purchase the EA Bots here.